See the trade
before it happens

Stop guessing. Our Vision AI scans 180,000+ assets to find the patterns humans miss. Get a complete trading plan: entry, exits, stop-loss - in under 60 seconds. For any market. Stop guessing. Our Vision AI scans 180,000+ assets to find the patterns humans miss.

What you see vs. what AI sees

Peel back the layers of a single chart to understand your unfair advantage with Vision AI.

Layer 1
WHAT HUMANS SEE
Basic price action. Choppy consolidation.
Human view
Layer 2
PATTERN RECOGNITION
Visual formation analysis
Multi-timeframe
Layer 3
MARKET PSYCHOLOGY & RISK
Tension, traps, and trader sentiment
Indicators
Layer 4
INDICATOR INTELLIGENCE
87 indicators processed
Patterns
Layer 5
SUPPORT/RESISTANCE
Key level mapping
S&R
Layer 6
THE TRADING PLAN
Actionable execution strategy
Setup
XAU/USD
$4,208.54 INTV: 15M
$4,208.54 INTV: 15M
$4,208.54 INTV: 15M
$4,208.54 INTV: 15M
$4,208.54 INTV: 15M
$4,208.54 INTV: 15M
Layer 1/6
LAYER 1: WHAT HUMANS SEE
LAYER 2: PATTERN RECOGNITION
LAYER 3: MARKET PSYCHOLOGY & RISK
LAYER 4: INDICATOR INTELLIGENCE
LAYER 5: SUPPORT/RESISTANCE
LAYER 6: THE TRADING PLAN
Price is stuck in a narrow, sideways range. Retail traders see a confusing market with no clear trend direction.
AI detects 'Volatility Compression'. Price is coiling tightly between $4,203 and $4,229 like a wound spring, signaling a potential big move.
AI senses extreme tension ("spring wound up"). Traders are awaiting a catalyst. High risk of "bull traps" and stop-hunts near resistance edges. Maximum patience.
MACD: Bearish cross. SuperTrend: Resistance at $4,226. ATR: Extremely low ($5.81). Indicators show pent-up energy with a slight bearish bias.
Critical Resistance: $4,226–$4,229 (Fib/Structure). Critical Support: $4,202–$4,203. The area between is a high-risk 'No-Trade Zone'.
The complete trading plan - built from patterns invisible to the naked eye. Entry, stop, target, and risk/reward ready before the breakout even starts.

Still trading like it's 2019
with manual analysis?

Manual analysis is slow, emotional, and prone to error. Automate your edge with AI-driven execution and visualize success in seconds.

without Investing.com
  • Open TradingView & add 8 different indicators
  • Switch between 5 timeframes manually to find alignment
  • Second-guess RSI divergence and miss the entry
  • Check newsfeeds and economic calendars
  • Enter trade with sweaty palms and no exit plan
Time Spent
2h 14m
With Investing.com
  • Click “Analyze Chart” button
  • Instant multi-timeframe scan (1m to monthly)
  • Entry, stop, target - auto-calculated by AI
  • Institutional-grade data validation
  • Zero emotion execution
Time Spent
58 seconds

Unlimited access to most-used features

"Wait, but what about TradingView?"

Feature
Investing.com
TradingView
What can I use it for?
Charts per page
Unlimited charts
Unlimited
Up to 16 (plan-dependent)
Monitor multiple tickers and timeframes side by side
Indicators per chart
Unlimited alerts
Unlimited
Up to 50 (plan-dependent)
Stack RSI, MACD, Bollinger & Volume on one chart
Chart timeframes
Unlimited watchlists
1 minute and above (all plans)
1m and above on all plans; 1s–45s on expensive plans only
Scalp trades with precision using ultra-short candles
Price alerts
AI chart analysis
Unlimited, don't expire
Up to 1,000 on most expensive plans
Get notified the moment NVDA hits $190.4
Watchlists
Unlimited chart layouts
Unlimited
Unlimited on paid plans only
Keep separate lists for Crypto, Stocks & Forex
Watchlist symbols
Unlimited
Up to 100 on basic plan
Track every stock in an index without hitting a cap
Portfolios
Unlimited
Up to 7
Manage separate portfolios per strategy or account
Holding symbols
Unlimited
Up to 150 on most expensive plans
Hold a diversified position list without cutting symbols
AI chart analysis
10/m for Pro, 50/m for Pro+
Not available
Spot risks and opportunities on any chart, instantly
Chart layouts
Unlimited
Unlimited on most expensive plans
Switch between scalping and swing setups in one click
Screener fundamental and technical metrics
167+ metrics
100+ metrics
Filter by EPS growth, RSI, P/E ratio, and 160+ more
Predefined screens
60+
Not available
Jump straight into curated screens. No setup needed
Features TradingView has that we don't

These are powerful features. Genuinely useful. IF you use them.

  • Pine Script (custom coding)
  • Replay mode (historical playback)
  • Volume profile (advanced)
  • Social trading feed
  • Backtesting engine
But ... do you actually use them?

When was the last time you wrote a script? Or ran a complex backtest?

If the answer is “Never”, then why is it in your monthly bill?

With Investing.com you pay for useful tools,
not complex features you'll never touch.

Trusted by top analysts & traders

From professional analysts with millions of followers to day traders grinding daily.

Investing Simplified - Professor G
DAY TRADER

It used to take me hours and sometimes days to compile this information and now it’s readily available in seconds.

@NolanGouveia (419K subscribers)
Bald Guy Money
DAY TRADER

InvestingPro helps you improve your diversification and upside opportunity.

@baldguymoneyofficial (125K subscribers)
Viktoriya M Finance
DAY TRADER

If you’re a trader or simply want a more active approach to time your entries, this tool is incredibly powerful.

@ViktoriyaMFinance (11.5k subscribers)

9 more tools built for
day traders

AI chart analysis is just the beginning. Here's your full institutional toolkit—every tool, every feature, every edge you need to win.

1/9 WarrenAI: Your AI trading assistant

Type any question, get instant analysis that includes: all relevant technical indicators, visual charts and clear verdicts.

10 seconds, one answer.

2/9 Unlimited technical indicators on charts

All 61 indicators available—RSI, MACD, Ichimoku, Bollinger Bands, Volume Profile, VWAP, and more. Layer unlimited indicators on any chart.

Competitors charge $200/month for 50 indicators. You get them all included.

3/9 Unlimited charts & saved layouts

Open and save unlimited real-time charts and custom layouts. Switch between day/swing trading and sector analysis.

Competitors limit to 2 live view charts. You get unlimited.

4/9 Track any symbol worldwide

Track any market or asset with technical tools. Get the same RSI, MACD or chart analysis on DAX as on Tesla or Bitcoin.

Most platforms limit coverage to US markets. You get 180,000+ symbols worldwide with full data.

5/9 Price alerts: Unlimited alerts that never expire

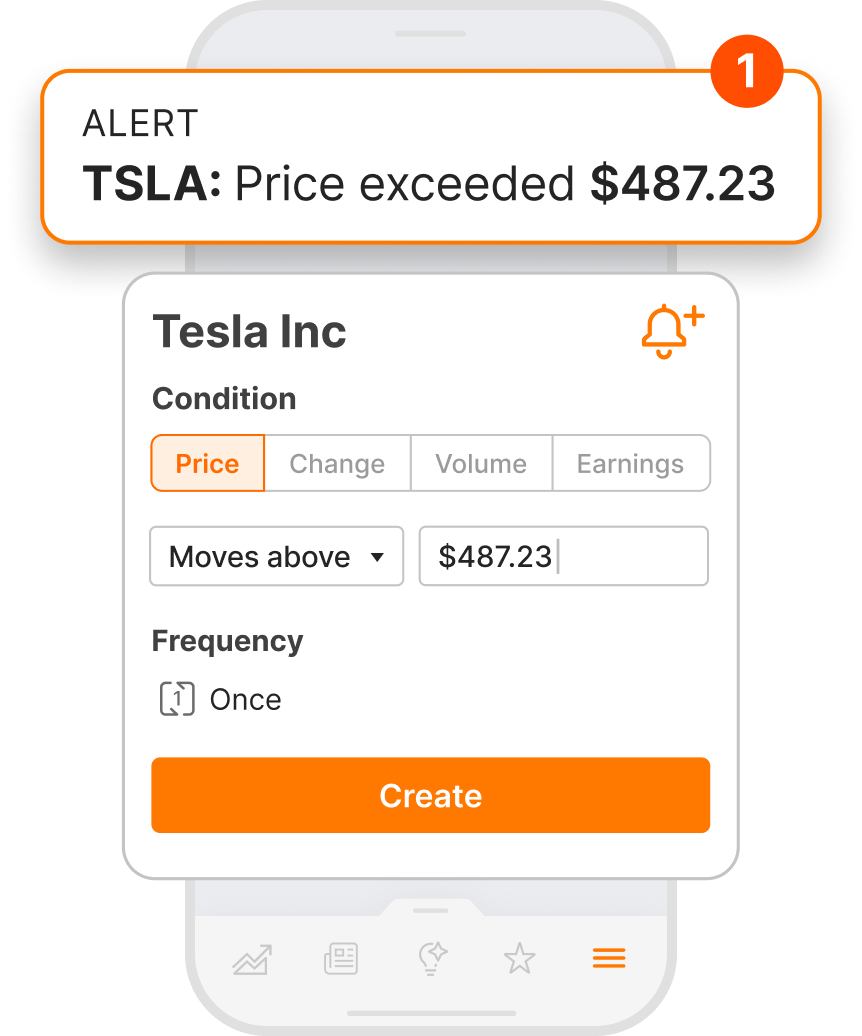
Create unlimited alerts for price movements, % changes, volume spikes and earnings announcements.

TradingView limits free users to 1 alert. Others expire after 30-90 days. You get unlimited alerts that never expire.

6/9 ProResearch: PDF analysis reports

Major stocks include detailed momentum analysis, with rank vs sector peers, technical summaries and more.

See exactly how your stock compares to competitors—if NVDA is at 84% of its 52-week high while peers are at 95% and 82%, you know who's leading and who's lagging.

7/9 Advanced chart types

Access Renko, Kagi, Line Break and Point & Figure charts that focus on pure price movement. Available for all timeframes.

Most platforms paywall these advanced charts at $20-40/month. You get access to all advanced chart types.

8/9 Pattern scanner
8/9 Pattern scanner

Auto candlestick pattern detection across timeframes (15-min to monthly). Filter by direction and reliability to spot setups instantly.

Manually scanning charts for patterns takes hours. Pattern scanner finds them all instantly with reliability scores.

9/9 Stock screener: 30+ technical filters

Use preset screens like 'Technical Titans' and 'Near 52-Week Highs', or build custom screens with filters such as RSI, MACD, Stochastic and more.

Find oversold bounces, momentum breakouts, and high-volatility plays in seconds instead of manually scanning hundreds of charts.

Ready for your next
10X trade move?